Executive Summary
- Macroeconomic yield curve analysis offers unparalleled foresight into economic trajectories and market sentiment.
- Strategic fixed income navigation necessitates deep understanding of curve shapes, duration dynamics, and credit spread behavior.
- Active management and sophisticated hedging protocols are crucial for optimizing portfolio returns amidst shifting interest rate regimes.
Understanding the Yield Curve’s Foundational Principles
The yield curve graphically depicts the relationship between bond yields and their maturities. It serves as a potent barometer for economic expectations. Investors demand varying compensation for locking up capital over different time horizons. This differential forms the curve’s distinct shape.
Short-term yields reflect current monetary policy and immediate liquidity conditions. Conversely, long-term yields incorporate expectations for future inflation, economic growth, and fiscal policy. The slope and curvature reveal critical market insights. Analyzing these dynamics is foundational for astute fixed income professionals.
Three primary theories attempt to explain the yield curve’s structure. The pure expectations theory posits that long-term yields are solely an average of expected future short-term rates. It assumes investors are indifferent to maturity. However, real-world data often contradicts this premise.
The liquidity preference theory introduces a liquidity premium for longer maturities. Investors typically prefer shorter-term bonds for their greater flexibility. Thus, they demand higher yields for longer-term commitments. This preference contributes to an upward-sloping curve.
Market segmentation theory argues that different investor groups operate in specific maturity segments. For instance, pension funds often favor long-term bonds for liability matching. Banks might prefer short-term instruments. These distinct demands create segmented supply-demand dynamics. Each theory offers valuable insights into the curve’s complex behavior.
Interpreting Yield Curve Shapes: Predictors of Economic Cycles
The prevailing shape of the yield curve provides crucial economic forecasts. Its contour signals market consensus regarding future economic growth and inflation. Understanding these patterns is paramount for strategic positioning. Different shapes correlate strongly with distinct economic phases.
A normal yield curve slopes upward. Long-term yields are higher than short-term yields. This configuration typically indicates expectations of economic expansion. It reflects healthy economic growth and moderate inflation. Most economic periods exhibit this upward slope.
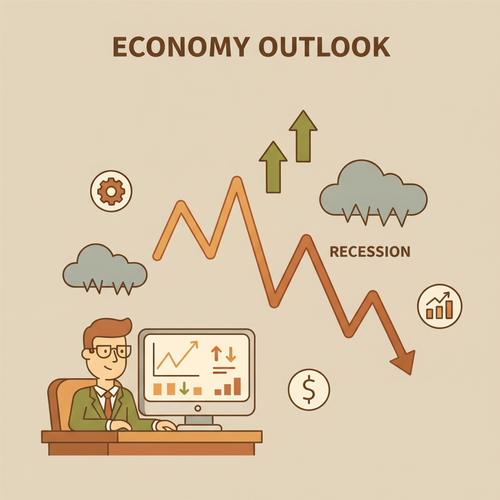
An inverted yield curve slopes downward. Short-term yields exceed long-term yields. This is often a reliable precursor to economic recession. Market participants anticipate slower growth or future interest rate cuts. The 3-month Treasury bill and 10-year Treasury note spread is a closely watched indicator.
Market Warning: Yield Curve Inversion
Historically, a sustained inversion of the yield curve has preceded nearly every U.S. recession. While not infallible, it demands heightened vigilance from fixed income strategists. Investors should assess their duration exposure rigorously.
A flat yield curve suggests economic uncertainty. Short-term and long-term yields converge. This shape often signals a transitional period. It might precede an inversion or a steepening, depending on economic developments. Monetary policy tightening can contribute to curve flattening.
A humped yield curve is less common. Medium-term yields are higher than both short-term and long-term yields. This specific shape can indicate unusual supply/demand dynamics. It might also reflect particular expectations for future inflation or growth rates. Each curve shape offers distinct strategic implications.
Duration Management in Dynamic Yield Environments
Duration is a critical metric for fixed income portfolio management. It measures a bond’s price sensitivity to interest rate changes. Higher duration implies greater price volatility. Effective duration management is vital for navigating fluctuating yield environments. Investors must actively control this exposure.
Macaulay duration represents the weighted average time until a bond’s cash flows are received. Modified duration then translates this into a percentage price change for a 1% change in yield. These metrics quantify interest rate risk. Portfolio managers use them to calibrate risk tolerance.
Strategic duration positioning involves selecting an appropriate average duration for a portfolio. A “barbell” strategy involves holding very short-term and very long-term bonds. This contrasts with a “bullet” strategy, which concentrates maturities around an intermediate point. Each approach has unique risk-return characteristics.
Immunization strategies aim to shield a portfolio from interest rate risk. They match the duration of assets to the duration of liabilities. This is particularly relevant for pension funds and insurance companies. Effective immunization requires rebalancing as interest rates or time horizons change.
Convexity is another crucial concept alongside duration. It measures the rate of change of a bond’s duration. Bonds with positive convexity experience smaller price decreases and larger price increases for a given yield change. Actively managing both duration and convexity optimizes risk-adjusted returns. Learn more about duration here.
Credit Spreads and Risk Premiums: A Deeper Dive
Credit spreads represent the additional yield investors demand for holding a bond over a comparable Treasury bond. This premium compensates for credit risk. It reflects the perceived likelihood of default. Credit spreads are a vital indicator of market risk appetite and economic health.
Wider credit spreads generally signal increased market fear or deteriorating economic conditions. Investors require greater compensation for credit exposure. Conversely, tightening spreads often indicate improving economic prospects. This suggests reduced perceived default risk. Spreads move dynamically.
The relationship between credit spreads and the business cycle is significant. Spreads typically widen during recessions and economic downturns. They narrow during periods of economic expansion. Monitoring these movements provides insights into investor sentiment. It also informs asset allocation decisions.
Distinctions exist between investment-grade and high-yield (junk) bond spreads. High-yield bonds inherently carry greater default risk. Their spreads are consequently wider and more volatile. Investment-grade spreads are narrower, reflecting higher credit quality. Diversification across credit tiers mitigates specific risks.
Liquidity premiums also influence credit spreads. Less liquid bonds often trade at higher yields. This compensates investors for the difficulty in selling them quickly. Understanding these nuances allows for more sophisticated fixed income portfolio construction. It helps assess true risk-adjusted returns.
Monetary Policy’s Influence on Curve Dynamics
Central bank monetary policy exerts profound influence over the yield curve. Actions by institutions like the Federal Reserve directly impact short-term interest rates. These policy shifts then ripple through the entire term structure. Their decisions are pivotal for fixed income markets.
Interest rate hikes, for example, primarily affect the short end of the curve. The federal funds rate target directly guides overnight lending rates. This causes short-term yields to rise. The long end of the curve reacts more to inflation expectations and economic growth outlooks.
Quantitative Easing (QE) involves large-scale asset purchases by the central bank. This aims to lower long-term interest rates directly. QE suppresses bond yields by increasing demand. Conversely, Quantitative Tightening (QT) reduces the central bank’s balance sheet. QT can put upward pressure on long-term yields.
Forward guidance is another potent tool. Central banks communicate their future policy intentions. This aims to anchor market expectations for interest rates and inflation. Clear guidance can reduce uncertainty. It can also influence the longer end of the yield curve.
Fiscal policy also plays a role in long-term yields. Increased government borrowing can increase the supply of bonds. This potentially pushes long-term yields higher. The interplay between monetary and fiscal policy is complex. It continuously shapes the yield curve’s trajectory.
Strategic Fixed Income Allocation Across Curve Segments
Effective fixed income management involves strategic allocation across different yield curve segments. Each segment offers distinct risk-reward profiles. Optimal positioning depends on market outlook and investor objectives. This active approach enhances portfolio performance.
Short-term bonds prioritize liquidity and capital preservation. They exhibit lower interest rate sensitivity. These instruments are suitable for cash management or funds with short horizons. Their yields are closely tied to current central bank policy. They offer stability in volatile markets.
Intermediate-term bonds strike a balance between yield and interest rate risk. This segment often provides a “sweet spot” for many investors. They offer reasonable income without excessive volatility. These bonds are a core holding for diversified fixed income portfolios.
Long-term bonds generally offer higher yields. However, they carry significantly greater interest rate risk. Their prices are highly sensitive to yield fluctuations. Long bonds can provide substantial capital appreciation if rates fall. They also offer inflation hedging in certain scenarios.
“Riding the curve” is a strategy exploiting the upward slope of a normal yield curve. Investors purchase longer-term bonds and sell them as they approach maturity. This captures the yield difference as the bond “rolls down” the curve. This strategy relies on an unch-aging curve shape.
Spread trades involve simultaneously buying and selling different maturities or credit qualities. A “flattening trade” involves buying short-term bonds and selling long-term bonds. This profits if the curve flattens. Conversely, a “steepening trade” anticipates the curve becoming steeper.
Advanced Hedging Techniques for Yield Curve Risk
Sophisticated investors employ advanced hedging techniques to mitigate yield curve risk. These strategies protect portfolio value from adverse interest rate movements. They are essential for large institutional portfolios. Effective hedging requires precise execution.
Interest rate swaps are common derivatives for managing interest rate exposure. Parties exchange fixed-rate interest payments for floating-rate payments. This allows conversion of floating-rate assets into fixed-rate ones, or vice-versa. Swaps effectively alter portfolio duration without trading underlying bonds.
Treasury futures contracts offer another potent hedging tool. These contracts allow investors to lock in future bond prices. Selling Treasury futures can hedge against rising interest rates. Buying them hedges against falling rates. Futures are highly liquid and efficient.
Options on bonds or bond futures provide asymmetrical risk exposure. They offer the right, but not the obligation, to buy or sell. This allows for tailored hedging strategies. For example, buying put options on long-term bonds protects against sharp yield increases.
Cross-hedging involves using futures or options on one type of bond to hedge another. For instance, using Treasury futures to hedge corporate bond exposure. This is effective when the two instruments have a high correlation. Careful basis risk management is crucial here.
Key rate duration is a more granular measure of interest rate sensitivity. It assesses a portfolio’s sensitivity to rate changes at specific points along the yield curve. This allows for precise hedging of specific curve segments. This advanced analysis enhances risk control. Explore yield curve concepts in depth.
Conclusion
Macroeconomic yield curve analysis provides indispensable insights for fixed income professionals. Its dynamic shapes signal shifts in economic growth and inflation expectations. Strategic navigation demands a comprehensive understanding of these underlying drivers. This includes duration, credit spreads, and central bank policy.
Mastery of these concepts enables superior portfolio construction and risk mitigation. Active management and advanced hedging techniques are paramount. They allow investors to capitalize on opportunities. They also protect against adverse market movements.
Are your current fixed income strategies fully optimized for the evolving macroeconomic landscape?